Comprehensive Quality Evaluation
The ReDem Total Quality Score (R-Score) provides a multidimensional evaluation of data quality in open-ended and close-ended survey responses. Built on a 360-degree assessment framework, each respondent’s data is systematically analyzed across multiple quality dimensions.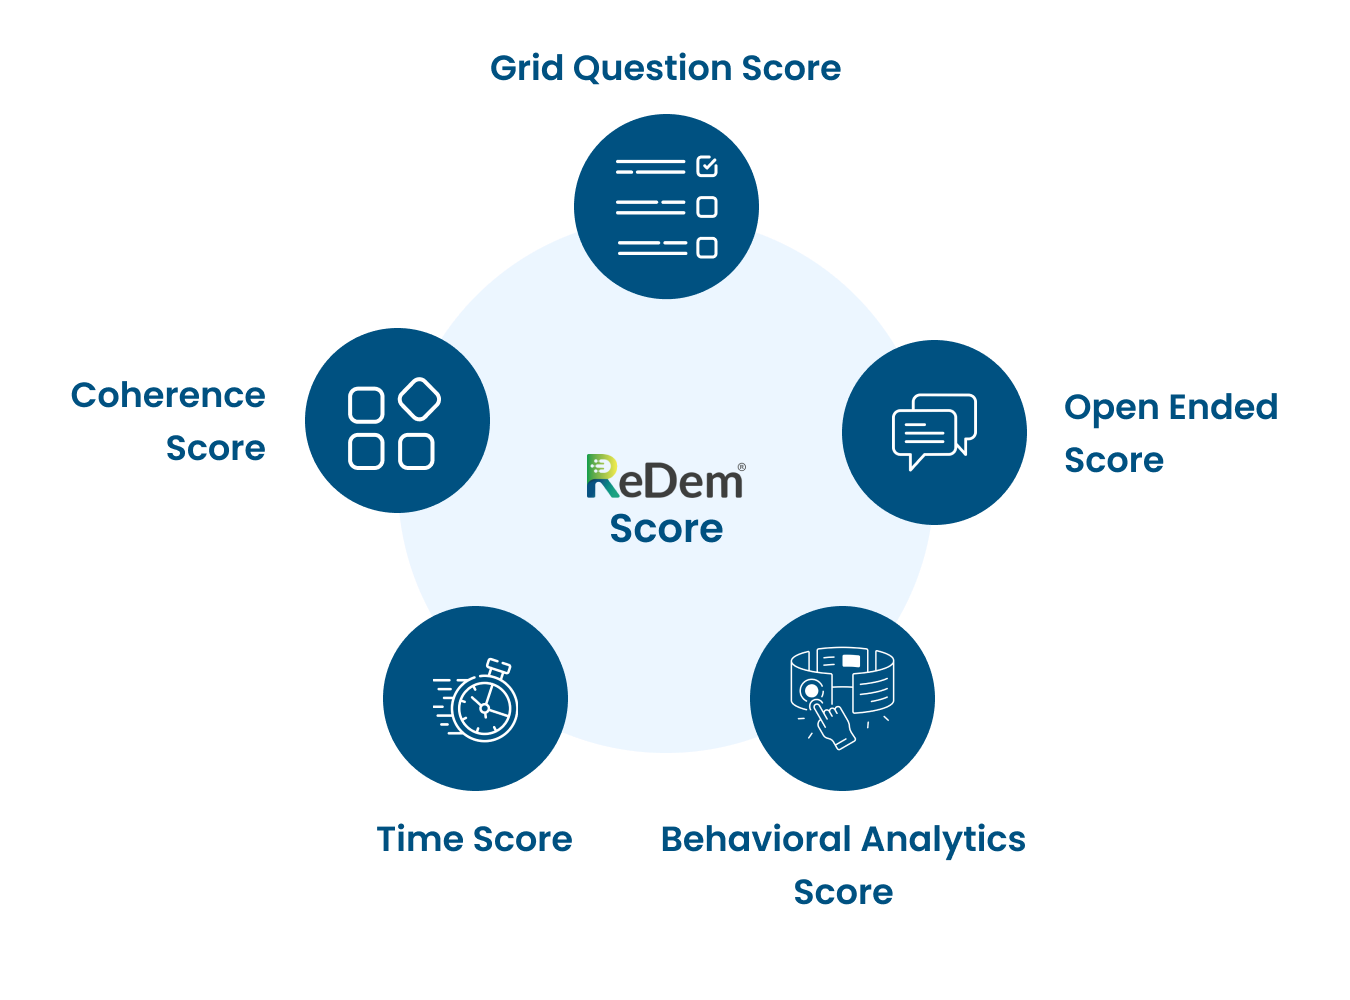
- 0 indicates no trust in the interview quality.
- 100 represents complete trust.
- 🔴 Red (0–39)
- Very poor quality interviews.
- Often indicative of fraudulent responses.
- Must be removed from the dataset.
- 🟡 Yellow (40–59)
- Doubtful quality.
- May include inattentive or low-engagement participants.
- Should also be removed to maintain data integrity.
- 🟢 Light Green (60–79)
- Acceptable quality.
- Especially scores between 60 and 70 are not ideal, but still passable.
- These interviews mark the cut-off threshold: We recommend removing all interviews scoring below 60.
- 🟢 Dark Green (80–100)
- Good to very good quality.
- High confidence in the data’s reliability.
Objective and Transparent Scoring
The R-Score consolidates a broad range of quality indicators into a single, interpretable metric. This includes automated checks for inconsistencies, duplications, unnatural response patterns, language compliance, and other behavioral markers indicative of low-quality or fraudulent input.Robust Against Fraudulent Responses
By embedding quality control mechanisms throughout the survey process, ReDem ensures that data integrity is maintained at every step. This systematic approach minimizes the risk of undetected manipulation and provides researchers with a reliable basis for downstream analyses.The Subscores of the ReDem Score
Open-Ended Score
Evaluates the quality of open-ended answers using AI. It considers factors such as relevance, duplication, and potential AI generation to detect inattentive, generic, or fraudulent responses.
Coherence Score
Assesses the logical consistency and plausibility of a respondent’s answers across the entire interview. This score helps automatically identify contradictions and inconsistencies in response patterns.
Time Score
Analyzes total interview duration and time spent per question. It flags responses that are too fast, too slow, or show irregular timing patterns compared to the expected baseline.
Grid-Question Score
Evaluates response behavior in grid questions. It detects different patterns, such as straight-lining or zigzag answering, using machine learning.
Behavioral Analytics Score
Analyzes typing behavior to distinguish natural human input from potentially automated or artificial entries. It considers typing speed, rhythm, and variability to flag suspicious input patterns.